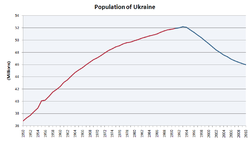
The author of our class textbook, Dr. Paul Rubenstein said in the book that “Several Eastern European countries, most notably Russia, have negative NIRs [Natural Increase Rate]….Eastern Europe’s relatively high death rates and low birth rates are a legacy of a half-century of Communist Rule.” Since I have chosen the City of Kiev in the Ukraine as my area of interest, this struck me as an interesting phenomenon since Malthus and many other scholars predict that the world’s population will always increase at a geometric rate. Obviously this is not true in Russia, Ukraine, and some of the other republics of the former Soviet Union.
The Ukraine and the other republics are obviously in Stage 4 population growth model.. As can be seen in the nearby graph, not only have they achieved Zero Population Growth, they are actually experiencing negative population growth. Dr. Rubenstein states that this is due to, “[h]igher death rates, which may be a result of inadequate pollution controls… [and] [l]ower birth rates may stem from very strong family-planning programs and deep seated pessimism about having children in an uncertain world. "
Looking into the issue further, the higher death rates in the former Soviet republics can also be linked to poor diets and deteriorating medical care in many of these areas, and also to personal choice factors such as wide spread smoking and alcoholism. Ukraine also has had one of the lowest birth rates of any MDC over the last ten years. Their birth rate reached a catastrophic level of 1.1 in the late 1990s and early 2000s. This is far below the accepted natural replacement rate of 2.2-2.4 [Source: The Ukrainian Week, (International Editions) March 14, 2012; http://ukrainianweek.com/Society/43071] Infant mortality has been a problem also, with two of the biggest problems for Ukrainian children being poverty and poor health care.
The lower birth rates and increased infant mortality during the two decades after the break up of the Soviet Union in 1991 can be easily seen by comparing the Ukrainian population structure graphs below for the years 1985 and 2012. The 1985 structure (six years before the Soviet breakup) shows a fairly normal “pyramid” shape that would be typical of MDCs. However the 2012 graph shows a marked decrease in the under 20 year old population, and the structure is transitioning to a diamond shape, with the largest percentage of the population in the 30 to 60 age groups.
However, the rate of population decline has recently slowed, with average life expectancy increasing and infant mortality decreasing from 10.4 to 8.9 per 1000 [op.cit. Wikipedia] Additionally, according to The Ukrainian Week, “The generation shift and partial adjustment of the population to the new socio-economic environment in the early 2000s brought the first signs of improvement of the demographic scene, further supported by targeted steps of the new government that came to power after the Orange Revolution. These included financial aid to mothers, specifically increased child birth benefits. Over 2001-2009, the number of births rose by 36%, the birth rate per one woman grew by 34%. “[Op.Cit. Ukrainian Week]
This information would tend to indicate the Dr. Rubenstein’s prediction that, “Eastern Europeans may display birth and death rates more comparable to those in Western Europe”, is actually occuring with the improved political stability and economic progress that the Ukraine has seen since 2008.

.jpg)

No comments:
Post a Comment